Social Network Analysis
Overview
Social Network analysis is the study of structure, and how it influences health, and it is based on theoretical constructs of sociology and mathematical foundations of graph theory. Structure refers to the regularities in the patterning of relationships among individuals, groups and/or organizations. When social network analysis is undertaken, the underlying assumption is that network structure, and the properties of that structure have significant implications on the outcome of interest.
Due to its focus on network structure rather than individual characteristics and or behaviors of network members, the data required for appropriate analysis differs from what is typically collected in non-relational epidemiologic study designs. Typically, study designs that focus on individual characteristics/behaviors and how those characteristics influence health, collect and conduct analysis on attribute data. Attribute data is defined as data that reflects the attitudes, opinions, and behaviors of individuals or groups. Conversely, social network analysis requires not only attribute data, but is built on the collection and analysis of relational data. Relational data refers to contacts, ties and connections, which relate one agent in a network to another. Relational data cannot be reduced to properties of the individual agents themselves but to a system/collection of agents.
Description
The majority of social network studies use either whole (Socio-centric) networks or egocentric study designs. Whole network studies assess relationships between individuals or actors that for analytical purposes are regarded as bounded or closed, even though in actuality the boundaries of the network are in fact permeable and/or ambiguous. When whole network studies are conducted, the focus of the study is to measure the structural patterns of how individuals within the network interact and how those patterns explain specific health outcomes. The underlying assumption made when whole network analysis is conducted, is that individuals that make up a group or social network will interact more than would a randomly selected group of similar size.
In a socio-centric study, members of the network are usually known or are easily determined because the focus is usually on closed networks that are a priori defined. For this reason, data collection for socio-centric network analysis involves enumerating all network members, and administering saturation surveys to all network members. A saturation survey provides respondents with a roster of all network members, and respondents are asked to identify members with whom they are affiliated. From this data, actor-by-actor matrices can be constructed and social network analysis can be conducted.
When the network of interest does not have clearly defined boundaries, socio-centric studies result in snowball or respondent driven sampling to generate the network and collect data to identify structural patterns. In respondent driven sampling, a small number of network members are interviewed and asked to name other network members, and those named members are also interviewed and asked to name other network members. This iterative process is continued until all network members are identified, or for an a priori set number of waves established before study initiation. The assumption made when respondent driven sampling is used is that the sampled network is representative of all other segments of the network from which data has not been collected. Respondent driven sampling uses name generator surveys to identify network members, followed by name interpreter questions to solicit information about the named actors, their characteristics, and relations to the focal actors.
Egocentric network designs, on the other hand, focus on a focal actor, ego, and the relationships between the ego and named actors or objects within their social networks. These types of designs collect data on the relationships involving the ego and the objects, alters, to which they are linked. Egocentric study designs use either name generators or position generators to obtain both attribute and relational data that can be used to construct actor-by-actor from which egocentric data analysis can be constructed. Position generators are used to identify people who fill particular value rolls, such as lawyers, where as name generators, as discussed above, are questionnaires that ask the ego questions about individuals to whom he or she is connected in a specific way. Unlike in socio-centric studies, however, resource constraints preclude the subsequent interview of named alters, and therefore the ego serves as the informant for not only their own relationships with the alters, but also the alters relationships with each other. Name generator questions like in socio-centric respondent driven sampling are usually followed by name interpreter questionnaires.
Analysis of Social Network Data
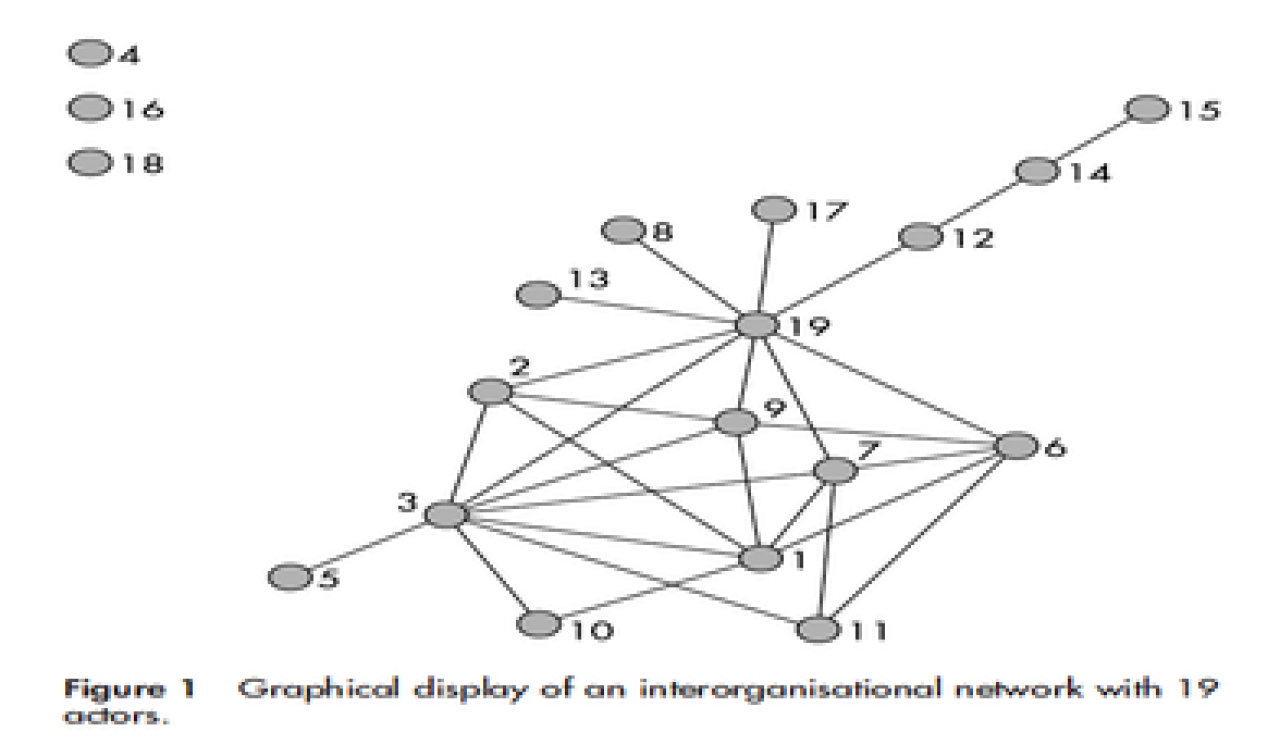
Network data, though collected at the level of the individual, is analyzed at the structural level. Data is organized as an actor-by-actor matrix as depicted in figure 1B. Data as displayed in figure one depicts the presence or absence of a tie. When the strength of a tie is also of interest, i.e. valued data, similarity or distance matrices could be used. Similarity matrices depict stronger ties with increasing numerical values, while increasing numerical values in distance matrices reflect weakened ties because the greater the distance between two actors, the weaker the ties. Any actor-by actor matrix can be converted into graphs and analyzed using social network analysis software such as UCINET.
Graphs are visual representations of a network. Actors within a network are displayed as nodes and the lines connecting nodes are representative of the ties between two actors. Graphs can be directed, indicating the relationship is directed from one agent to the other, or valued, indicating the strength of the tie. Though, visualizing the data is informative, the crux of social network analysis lies in the calculation of descriptive measures that reveal important characteristics about 1) position of network actors, 2) properties of network subgroups, and 3) characteristics of complete networks.
Position of network actors or the interconnectedness of network actors is often referred to as a measure of cohesion. There are two common measures of cohesion
Distance= the length of the shortest path that connects two actors
(Howe et al.)
Distance between points 15 and 11 is 5
Density = total number of relational ties divided by the total possible number of relationional ties

Components and cliques measure properties of network subgroups
A component is a portion of the network in which all actors are connected, either directly or indirectly.
(Howe et al.)
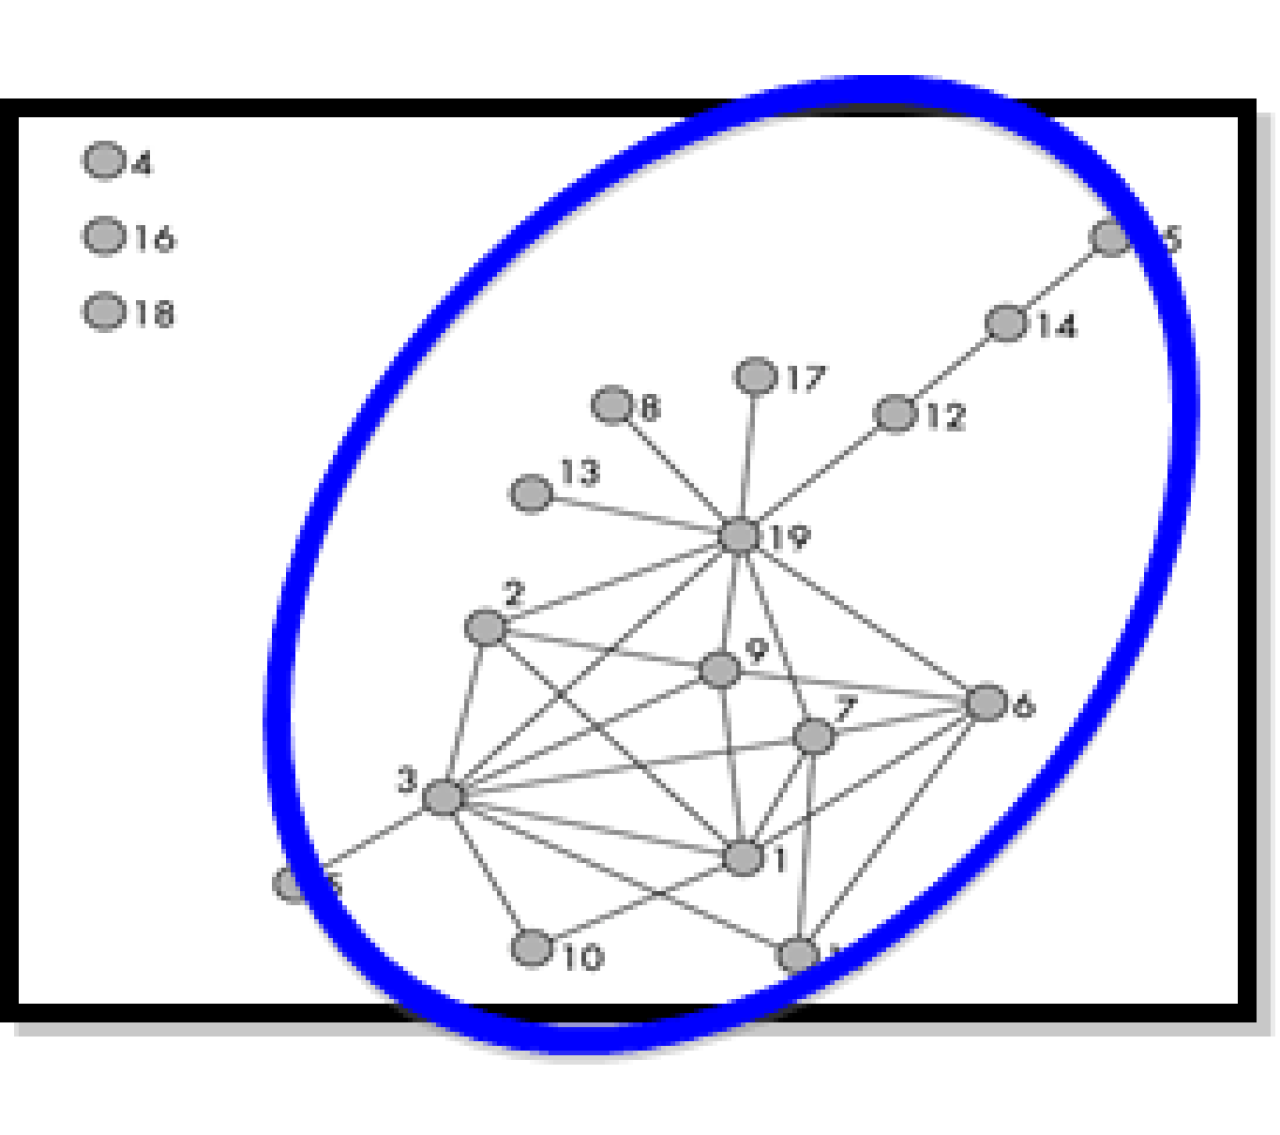
Nodes 1, 6, and & 7 form a clique
A clique is a subgroup of actors who are all directly connected to one another, and no other member of the network is connected to all members of the subgroup. Clique analysis is the most common techniques used to identify dense subgroups within a network.
Characteristics of complete networks are defined in terms of centrality. Centrality measures identify the most prominent actors within a network. It can be conceptualized as either local or global. Local centrality refers to the direct ties a particular node has, while global centrality refers to the number of direct and indirect ties of a particular node. Centrality is measured in terms of betweenness or degree. Betweenness refers to the number of times an actor connects different subgroups of a network that would otherwise not be connected. In figure 3 above, node 19 connects nodes 13, 8, 17, 12, 14, and 15 to the main network and serves as a prominent actor within the network. Its prominence is reiterated when degree centrality is considered. Degree centrality refers to the sum of all actors that are directly connected to an ego.

-
Node number 19 has a degree centrality of 9, which is the highest in the sociograph. The overall centralization measure refers to how tightly a graph is organized around its most central point. The measures of network structure that have been discussed above can then be use to parameterize predictive regression models that relate relational data to attribute data. For example, after generating measures of network structure using social network analysis methods, Lee et al used multivariable regression to evaluate associations between centrality measures and hospital characteristics.
Readings
Textbooks & Chapters
Scott J. Social network analysis: a handbook. Newbury Park: Sage, 2000.
This book provides an introduction to social network analysis. It briefly reviews the theoretical basis of social network analysis, and discusses the key techniques required to conduct this type of analysis. Specifically, it discusses issues of study design, data collection, and measures of social network structure.
Carrington PJ, Scott J, Wasserman S. Models and methods in social network analysisCambridge: Cambridge University Press, 2005.
This book provides a more detailed methodological approach to social network analysis. Chapter 2 provides a brief discussion about study designs, while chapter 3 focus on methods of data collection and model fitting.
Wasserman S, Faust K. Social network Analysis: methods and applications. Cambridge: Cambridge University Press, 1994.
M.E.J Newman. Networks. An Introduction. 1st edition Oxford University Press, 2010
This book is an introductory text that discusses social networks and social network analysis.
Methodological Articles
Social Network Analysis: A Methodological Introduction
Author(s): CT Butts
Journal: Asian Journal of Social Psychology
Year published: 2008
Author(s): PV Marsden
Journal: The Sage Handbook of Social Network Analysis
Year published: 2011
Author(s): S Bender-deMoll, DA McFarland
Journal: Journal of Social Structure
Year published: 2006
Dynamics of Dyads in Social Networks: Assortative, Relational, and Proximity Mechanisms
Author(s): MT Rivera, SB Soderstrom, B Uzzi
Journal: Annual Review of Sociology
Year published: 2010
A glossary of terms for navigating the field of social network analysis
Author(s): P Hawe, C Webster, A Shiell
Journal: J Epidemiol Community Health
Year published: 2004
Network analysis in public health: history, methods, and applications
Author(s): DA Luke, JK Harris
Journal: Annual Review of Public Health
Year published: 2007
Application Articles
Author(s): P Torfs, C Brauer
Year published: 2012
A comparative study of social network analysis tools
Author(s): Combe et al
Journal: France: Web Intelligence & Virtual Enterprises, Saint-Etienne
Year published: 2010
Author(s): M Huisman, MAJ van Duijn
Journal: Models and methods in social network analysis
Year published: 2005
The spread of obesity in a large social network over 32 years
Author(s): NA Christakis, JH Fowler
Journal: New England journal of medicine
Year published: 2007
Is obesity contagious? Social networks vs. environmental factors in the obesity epidemic
Author(s): E Cohen-Cole, JM Fletcher
Journal: Journal of health economics
Year published: 2008
Detecting implausible social network effects in acne, height, and headaches: longitudinal analysis
Author(s): E Cohen-Cole, JM Fletcher
Journal: Bmj
Year published: 2008
Author(s): TE Seeman, LF Berkman
Journal: Social Science & Medicine
Year published: 1988
Social Network Analysis of Patient Sharing Among Hospitals in Orange County, California
Author(s): BY Lee, SM McGlone, Y Song, TR Avery, S Eubank, CC Chang, RR Bailey, DK Wagener, DS Burke, R Platt, SS Huang
Journal: American Journal of Public Health
Year published: 2011
Transmission network analysis in tuberculosis contact investigations
Author(s): VJ Cook, SJ Sun, J Tapia, SQ Muth, DF Argüello, BL Lewis, RB Rothenberg, PD McElroy
Journal: J Infect Dis
Year published: 2007
Software
Description: R contains several packages relevant for social network analysis: igraph is a generic network analysis package; sna performs sociometric analysis of networks; network manipulates and displays network objects; PAFit can analyse the evolution of complex networks by estimating preferential attachment and node fitness; tnet performs analysis of weighted networks, two-mode networks, and longitudinal networks; ergm is a set of tools to analyze and simulate networks based on exponential random graph models exponential random graph models; Bergm provides tools for Bayesian analysis for exponential random graph models, hergm implements hierarchical exponential random graph models; 'RSiena' allows the analyses of the evolution of social networks using dynamic actor-oriented models; latentnet has functions for network latent position and cluster models; degreenet provides tools for statistical modeling of network degree distributions; and networksis provides tools for simulating bipartite networks with fixed marginals.
Price: Free
Description: statnet is a suite of software packages that implement a range of network modeling tools.
Price: Free
https://www.insna.org/
International Network for Social Network Analysis (INSNA) is a professional association for researchers interested in network analysis. The website contains SNA software descriptions, news, scholarly articles, technical columns, abstracts and book reviews. The site features graduate programs, courses, discussion forums, I-Connect, bibliographies and publications related to SNA. INSNA also provides a Journal of Social Networks and holds an Annual International Social Networks Conference and other SNA events.
Combe et al. (2010). A comparative study of social network analysis tools. France: Web Intelligence & Virtual Enterprises, Saint-Etienne
This article aims to describe the functionalities of social network analysis. In addition, the article explains and compares several of the widely used software tools that are dedicated to social network analysis. The software packages discussed in detail include Pajek, Gephi, NetworkX and igraph.
Websites
International Network for Social Network Analysis (INSNA)
Website overview: International Network for Social Network Analysis (INSNA) is a professional association for researchers interested in network analysis. The website contains SNA software descriptions, news, scholarly articles, technical columns, abstracts and book reviews. The site features graduate programs, courses, discussion forums, I-Connect, bibliographies and publications related to SNA. INSNA also provides a Journal of Social Networks and holds an Annual International Social Networks Conference and other SNA events.
Website overview: Statnet is a suite of software packages for network analysis that implement recent advances in the statistical modeling of networks. The analytic framework is based on Exponential family Random Graph Models (ergm). statnet provides a comprehensive framework for ergm-based network modeling, including tools for model estimation, model evaluation, model-based network simulation, and network visualization. This broad functionality is powered by a central Markov chain Monte Carlo (MCMC) algorithm.
statnet has a different purpose than the excellent packages UCINET or Pajek; the focus is on statistical modeling of network data. The statistical modeling capabilities of statnet include ERGMs, latent space and latent cluster models. The packages are written in a combination of (the open-source statistical language) R and (ANSI standard) C, and are called from the R command line. And because it runs in the R package (www.r-project.org), you also have access to the full functionality of R, including the packages "network" and "sna" written by Carter Butts. statnet has a command line interface, not a GUI, with a syntax that resembles R.
Courses
Host/program: University of Michigan/Coursera
Course format: Online
Software used: Gephia, Netlogo, R