K-Means Cluster Analysis
|
Software |
|
|
Courses |
Overview
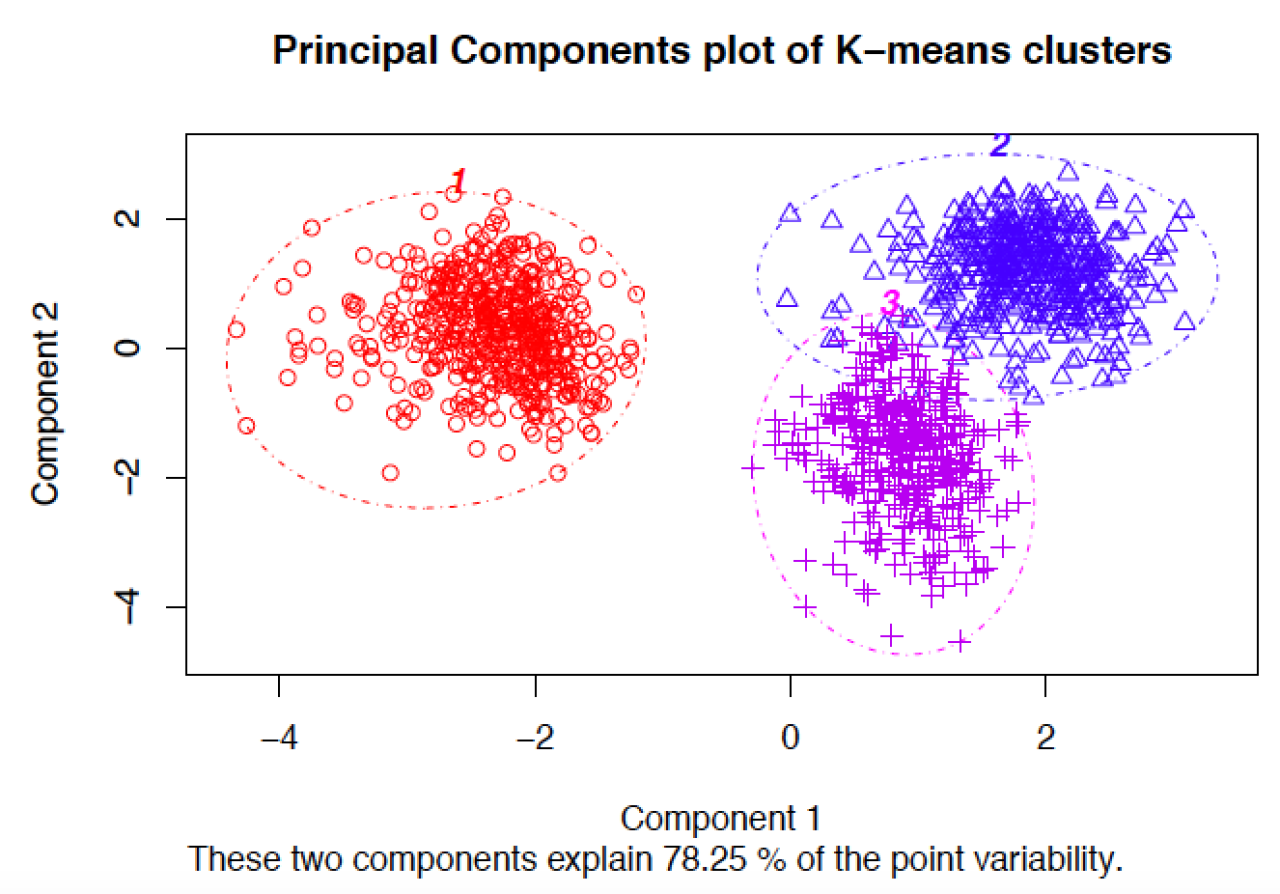
Cluster analysis is a set of data reduction techniques which are designed to group similar observations in a dataset, such that observations in the same group are as similar to each other as possible, and similarly, observations in different groups are as different to each other as possible. Compared to other data reduction techniques like factor analysis (FA) and principal components analysis (PCA), which aim to group by similarities across variables (columns) of a dataset, cluster analysis aims to group observations by similarities across rows.
Description
K-means is one method of cluster analysis that groups observations by minimizing Euclidean distances between them. Euclidean distances are analagous to measuring the hypotenuse of a triangle, where the differences between two observations on two variables (x and y) are plugged into the Pythagorean equation to solve for the shortest distance between the two points (length of the hypotenuse). Euclidean distances can be extended to n-dimensions with any number n, and the distances refer to numerical differences on any measured continuous variable, not just spatial or geometric distances. This definition of Euclidean distance, therefore, requires that all variables used to determine clustering using k-means must be continuous.
Procedure
In order to perform k-means clustering, the algorithm randomly assigns k initial centers (k specified by the user), either by randomly choosing points in the “Euclidean space” defined by all n variables, or by sampling k points of all available observations to serve as initial centers. It then iteratively assigns each observation to the nearest center. Next, it calculates the new center for each cluster as the centroid mean of the clustering variables for each cluster’s new set of observations. K-means re-iterates this process, assigning observations to the nearest center (some observations will change cluster). This process repeats until a new iteration no longer re-assigns any observations to a new cluster. At this point, the algorithm is considered to have converged, and the final cluster assignments constitute the clustering solution.
There are several k-means algorithms available. The standard algorithm is the Hartigan-Wong algorithm, which aims to minimize the Euclidean distances of all points with their nearest cluster centers, by minimizing within-cluster sum of squared errors (SSE).
Software
K-means is implemented in many statistical software programs:
In R, in the cluster package, use the function: k-means(x, centers, iter.max=10, nstart=1). The data object on which to perform clustering is declared in x. The number of clusters k is specified by the user in centers=#. k-means() will repeat with different initial centroids (sampled randomly from the entire dataset) nstart=# times and choose the best run (smallest SSE). iter.max=# sets a maximum number of iterations allowed (default is 10) per run.
In STATA, use the command: cluster kmeans [varlist], k(#) [options]. Use [varlist] to declare the clustering variables, k(#) to declare k. There are other options to specify similarity measures instead of Euclidean distances.
In SAS, use the command: PROC FASTCLUS maxclusters=k; var [varlist]. This requires specifying k and the clustering variables in [varlist].
In SPSS, use the function: Analyze -> Classify -> K-Means Cluster. Additional help files are available online.
Considerations
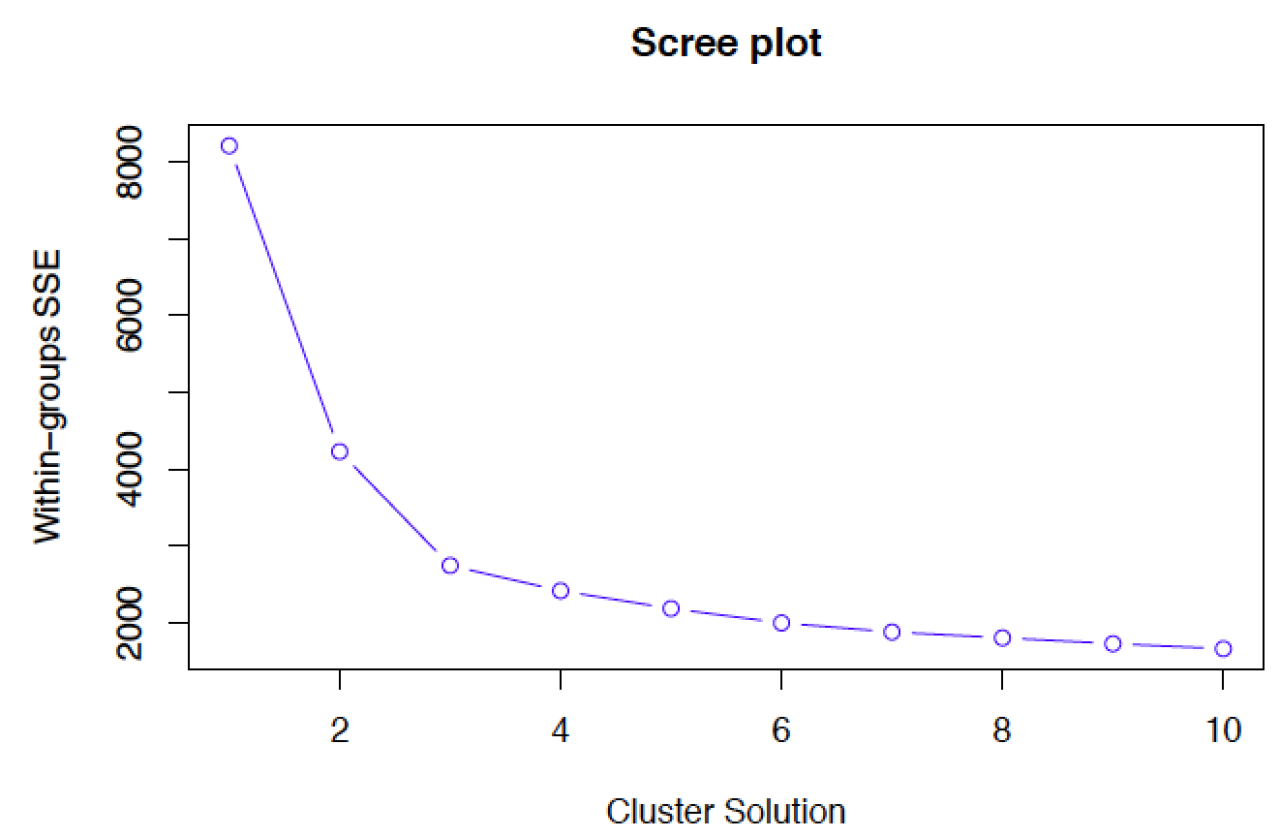
K-means clustering requires all variables to be continuous. Other methods that do not require all variables to be continuous, including some heirarchical clustering methods, have different assumptions and are discussed in the resources list below. K-means clustering also requires a priori specification of the number of clusters, k. Though this can be done empirically with the data (using a screeplot to graph within-group SSE against each cluster solution), the decision should be driven by theory, and improper choices can lead to erroneous clusters. See Peeples’ online R walkthrough R script for K-means cluster analysis below for examples of choosing cluster solutions.
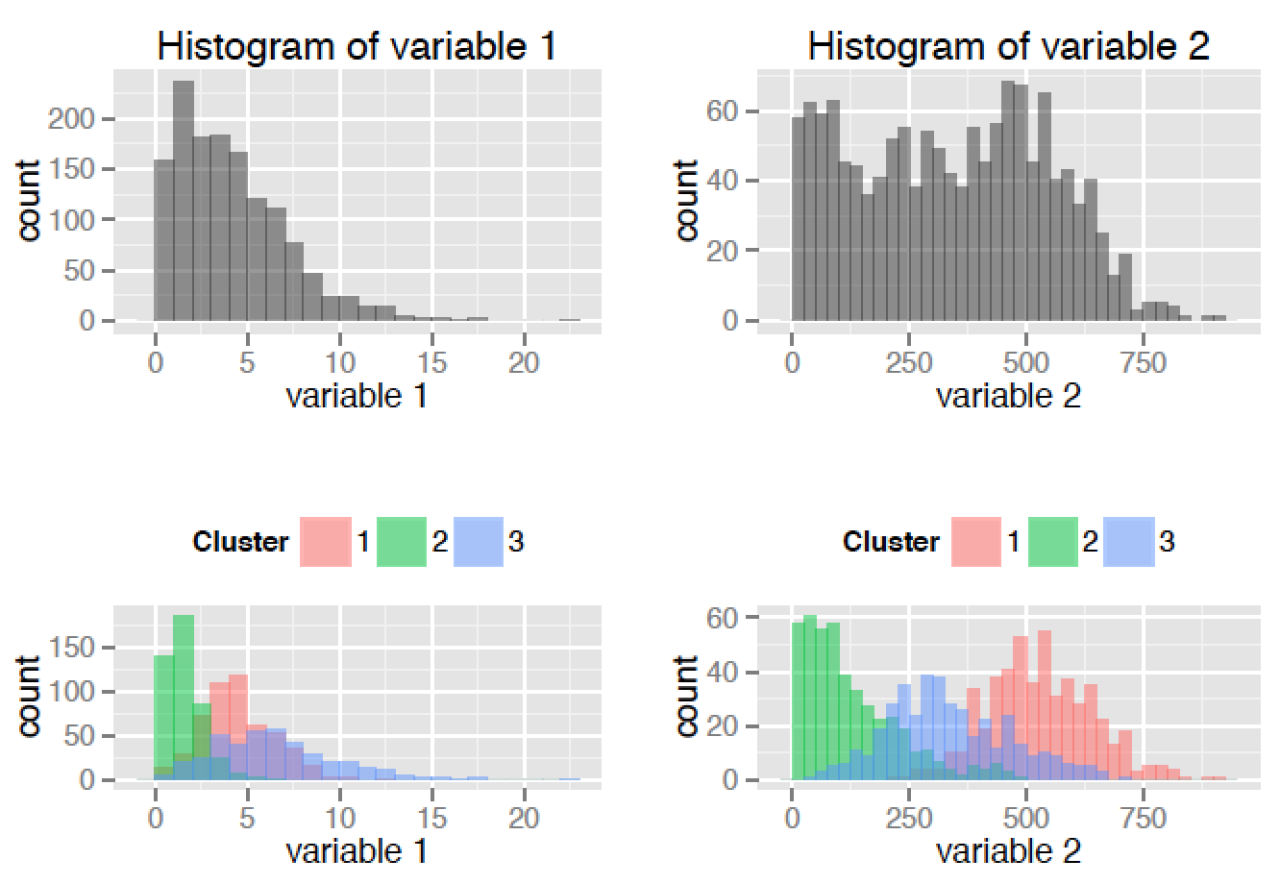
The choice of clustering variables is also of particular importance. Generally, cluster analysis methods require the assumption that the variables chosen to determine clusters are a comprehensive representation of the underlying construct of interest that groups similar observations. While variable choice remains a debated topic, the consensus in the field recommends clustering on as many variables as possible, as long as the set fits this description, and the variables that do not describe much of the variance in Euclidean distances between observations will contribute less to cluster assignment. Sensitivity analyses are recommended using different cluster solutions and sets of clustering variables to determine robustness of the clustering algorithm.
K-means by default aims to minimize within-group sum of squared error as measured by Euclidean distances, but this is not always justified when data assumptions are not met. Consult textbooks and online guides in resources section below, especially Robinson’s R-blog: K-means clustering is not a free lunch for examples of the issues encountered with k-means clustering when assumptions are violated.
Lastly, cluster analysis methods are similar to other data reduction techniques in that they are largely exploratory tools, thus results should be interpreted with caution. Many techniques exist for validating results from cluster analysis, including internally with cross-validation or bootstrapping, validating on conceptual groups theorized a priori or with expert opinion, or external validation with separate datasets. A common application of cluster analysis is as a tool for predicting cluster membership on future observations using existing data, but it does not describe why the observations are grouped that way. As such, cluster analysis is often used in conjunction with factor analysis, where cluster analysis is used to describe how observations are similar, and factor analysis is used to describe why observations are similar. Ultimately, validity of cluster analysis results should be determined by theory and by utility of cluster descriptions.
Readings
Textbooks & Chapters
-
Aldenderfer MS and Blashfield RK (1984). Cluster Analysis. Sage University Paper series on Quantitative Applications in the Social Sciences, series no. 07-044. Newbury Park, California: Sage Publications. The cluster analysis “green book” is a classic reference text on theory and methods of cluster analysis, as well as guidelines for reporting results.
-
Everitt BS, Landau S, Leese M, Stahl D (2011). Cluster Analysis, 5th ed. Wiley Series. In-depth and contemporary descriptions of the various types of cluster analysis methods as the field has developed.
-
Lorr M (1983). Cluster Analysis for Social Scientists. Jossey-Bass Social and Behavioral Science Series. Lorr’s classic text details related methods with data typically encountered in social sciences – K-means data assumptions are often difficult to meet with data in social sciences, and alternatives are discussed.
Methodological Articles
-
Hauser J and Rybakowski J (1997). Three clusters of male alcoholics. Drug Alcohol Depend; 48(3):243-50. An example of clustering behavior types in addiction research.
-
Breuhl S, et al. (1999). Use of clusters analysis to validate IHS diagnostic criteria for migraine and tension-type headache. Headache; 39(3):181-9. A study of validating diagnostic criteria using k-means on symptom patterns.
-
Guthrie E, et al. (2003). Cluster analysis of symptoms and health seeking behaviour differ- entiates subgroups of patients with severe irritable bowel syndrome. Gut; 52(11):1616-22. Care seeking behavior patterns are differentiated by cluster analysis.
Application Articles
-
MacQueen J (1967). Some methods for classification and analysis of multivariate observa- tions. Proceedings of the 5th Berkeley Symposium on Math. Statist. and Prob., Vol. 1. Early statistical methods paper about k-means the clustering algorithm from one of the early developers.
-
Salim SZ and Ismail MA. (1984). K-means-type algorithms: A generalized convergence theo- rem and characterization of local optimality. IEEE Trans Pattern Anal Mach Intell; 6(1):81-7. Methodological considerations and recommendations for the use of k-means clustering.
-
Saeed F, et al. (2012). Combining K-means clusterings of chemical structures using cluster- based similarity partitioning algorithm. Communications in Computer and Information Science; 322:304-312. A recent article on improving the performance of k-means cluster solutions through multiple-iteration and combination approaches.
Websites
Various walkthroughs for using R software to conduct k-means cluster analysis, with applied examples and sample code.
-
statmethods.net: Quick-R: Cluster Analysishttp://www.statmethods.net/advstats/cluster.html
-
2. R-statistics blog: K-means clustering http://www.r-statistics.com/2013/08/k-means-clustering-from-r-in-action/
-
3. Peeples MA (2011). R Script for K-means Cluster Analysishttp://www.mattpeeples.net/kmeans.html
-
4. Robinson D (2015). R bloggers: K-means clustering is not a free lunch http://www.r-bloggers.com/k-means-clustering-is-not-a-free-lunch/
Technical R resources
-
R kmeans() help file https://stat.ethz.ch/R-manual/R-devel/library/stats/html/kmeans.html
Related data reduction techniques
-
Exploratory factor analysis (EFA) on Advanced Epidemiology
-
Principal components analysis (PCA) on Advanced Epidemiology