Rasch Modeling
Overview
Item Response Theory (also known as Modern Test Theory) is a mathematical approach for quantifying latent traits based on the fundamental assumption that a subject’s response to an item is a function of the difference between 1) his/her abilities and 2) the characteristics of the item. Within this class, the Rasch model specifically defines difficulty/facility as the sole parameter of interest when evaluating items. This approach was developed in the 1950s by the Danish mathematician Georg Rasch as a tool for achievement testing among school children. In addition to its continued use in educational assessment, the Rasch model is widely applied by the social sciences, which depend heavily on patient-reported outcomes, and more recently, has been adopted by the fields of clinical and public health research as a tool for investigating diverse health outcomes, including rehabilitation and community violence.
Description
Purpose of the Model
In the physical sciences, fundamental (i.e. mass & volume) and derived (indirectly detected, i.e. density) measurements for quantifying the attributes of objects are widely available. However, owing to the complex nature of humans, measurements capable of capturing the unobservable qualities of beliefs and behaviors are less straightforward (“we can’t physically align bits of the human psyche” Bond & Fox 2012, pg 6). Clinicians and researchers frequently rely on scales, indices and other item-based quantitative instruments to derive variables for measuring latent constructs. For example, questions regarding hopelessness may be included on a scale developed to assess depression. The Rasch model provides a mathematical framework against which test developers can compare empirical data to assess an instrument’s capacity to emulate the properties of fundamental measurement (invariance and unidimensionality) and thus serve as a tool for quantifying unobservable human conditions.
Applied Rasch Analysis
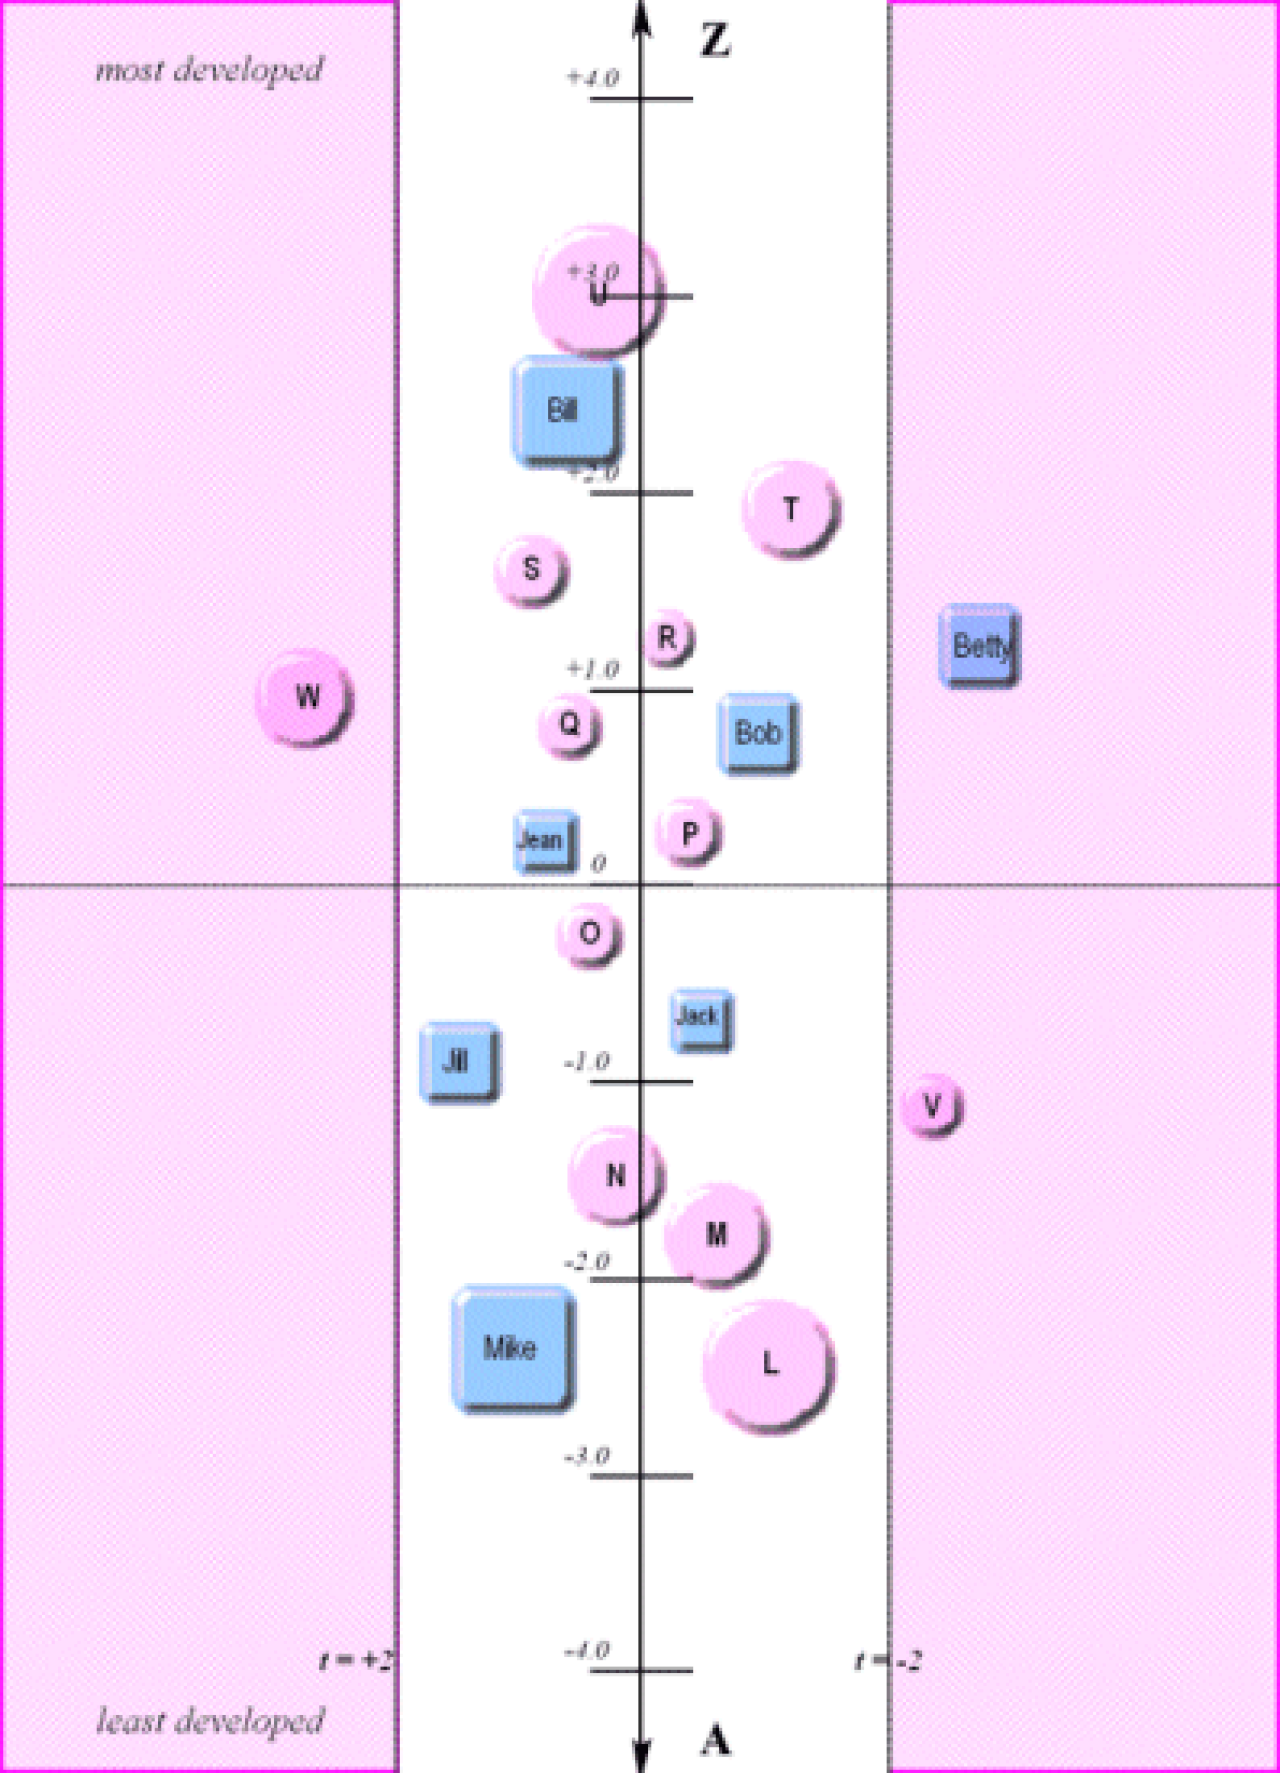
The Rasch model is built on the assumption that the most parsimonious and effective predictor of a trait is the relationship between the difficulty of an item and the ability of a person. It is based on the underlying logic that subjects have a higher probability of correctly answering easier items and a lower probability of answering more difficult items. An investigator begins instrument development by reviewing existing literature and evaluating any prior knowledge of the latent trait. The instrument is then piloted on a sample that meets the criteria for the target population (considering age, sex, health status, etc) and the resulting data are compared against the Rasch model. Figure 1 below (Bond & Fox 2007) and the following steps outline the approach taken by the Rasch model for assessing instrument development based on dichotomous data. Technical details are provided in the following section.
-
Calculate the percent correct for each person, this will result in an ordinal raw score. Convert the raw score percentage for each person into the odds of success by calculating the ratio of each person’s percent correct divided by the percent incorrect [(p) /(1-p)]. Take the log of the odds of success to calculate person ability. This transformation resolves the problem of compression at the ends of the raw scores. On the plot, blue squares represent person ability.
-
Repeat step 1 for item difficulty (percent subjects that answered item correct / percent of subjects that answered incorrect). On the plot, pink circles represent Item difficulty.
-
Plot these estimates against the idealized (perfect unidimensionality) Rasch model, which is portrayed on the plot as a vertical line and represents the relationship between items and ability on a logit (aka log odds ratio) scale. The average logit (probability of success) is set to 0.
-
The size of each object provides an inverse representation of its error (smaller objects have less error). Error is expected to increases at either end of the line as few subjects have low or high abilities and few items are scored incorrect or correct by all subjects. Item precision will increase with increased instrument administration, while person estimates will improve with the addition of appropriate items to the instrument.
-
Assess the fit of the empirical data to the idealized perfect line of the Rasch model. Fit values are read horizontally; a subject who falls outside of the white path (-2.0 to 2.0 for an N of 30-300) is considered to have poor fit and thus does not follow the expected response pattern.
-
If item and/or person deviations are found, re-evaluate the item wording or other aspects of misfitting items and repeat these steps. When the empirical data fit the Rasch model the the instrument sum is considered a sufficient statistic for use in future analyses.
Technical Aspects
Mathematical Representation
Once we have estimated subject ability (Bn) and item difficulty, (Di) we can express the probability of success by Equation 1, which states that the probability of a correct answer for subject n facing item i is a logistic function of the difference between the ability of the subject and the difficulty of the item.
Pni(x=1)=f(Bn-Di) = e(Bn-Di)/1+e(Bn-Di), where x=1 is correct & x=0 is incorrect (1)
Ability & Difficulty Estimation
Using statistical software (see table below), the probability of success for each item and subject is estimated by Conditional Maximum Likelihood Estimation*. Typically, subject-estimates are initially ignored and item estimates are calculated, these results are then used to calculate the first round of person-estimates. The process of iterating person and item estimates against each other continues until the ability-difficulty difference converges. This method is possible owing to the property of parameter separation. The result is an interval-level measure that represents a person’s ability independent of item difficulty. Fit statistics are then used to compare these estimates to the Rasch model.
*Depending on the software being used alternative estimation approaches include Joint Maximum Likelihood Estimates (JMLE), Marginal Maximum Likelihood Estimation (MMLE), or Pairwise Estimation (PAIR).
Model Fit
The degree of discrepancy between observed item performance and expected item performance can be quantified using goodness-of-fit statistics. Unweighted (outfit) and weighted (infit) mean square statistics are calculated by comparing the observed data to the model probability matrix. The residuals are assumed to follow a chi-square distribution and acceptable fit is identified by a chi-square probability exceeding 0.5. Standardized fit statistics are calculated based on a t-score, with acceptable values ranging from -2 to + 2 (expected =0). Additionally, Wald-tests can be applied to identify specific items that are poorly fitting and likelihood ratio tests can be applied to assess overall data fit.
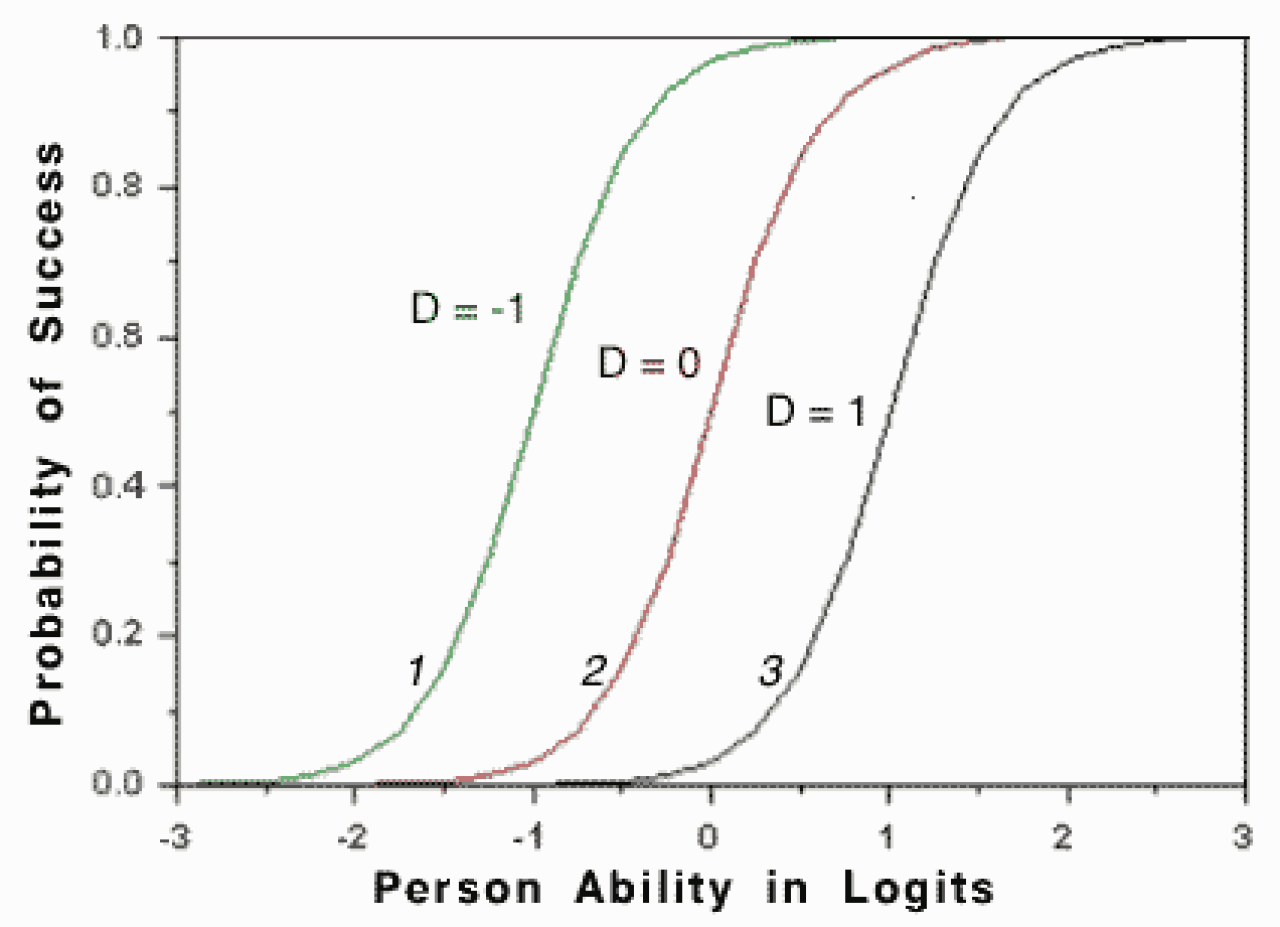
Additionally, as demonstrated by Figure 2 (J. Sick 2010 http://jalt.org/test/sic_5.htm) fit can be assessed visually by constructing an Item Characteristic Curve (ICC). The x-axis represents the latent trait on the logit scale and the y-axis represents the expected score for an item. The Rasch model predicts a sigmoidal curve and the fit of data can be assessed in comparison to this curve (observed data not depicted in figure). Easier items will fall to the left of 0 and more difficult items will fall to the right. An item’s estimated value can be identified by finding its location on the x-axis when the expect score is equal to 0.5.
Model Extensions
-
Rating Scale model (e.g. Likert Scales)
-
Partial Credit model
-
Many-Facets
-
Information on 2- and 3-parameter IRT models
Glossary
-
Concatenation: the combination of arbitrary units that demonstrate an additive (linear) relation; the basis of fundamental measurements
-
Conjoint measurement: increase in the level of an attribute (i.e. probability of correct response) with increases in the values of two other attributes (i.e. item difficulty and person ability).
-
Construct validity: the degree to which an instrument or test measures what it aims to measure based on its underlying theory
-
Interval scale: a measurement scale in which there is equal distance between units
-
Invariance: consistency of a measurement from one occasion to another, for example, constancy of a derived measure (i.e. density) in the face of variation of the underlying fundamental measures (i.e. mass and volume)
-
Latent Variable: a characteristic that can be inferred by observation of a behavior rather than direct measurement of an attribute
-
Parameter separation: estimation of one set of parameters independent of a second set of parameters
-
Unidimensionality: a measurement applies to only one attribute of an object
Readings
Textbooks & Chapters
Bond TG. and Fox CM. (2007). Applying the Rasch model: Fundamental measurement in the human sciences. Second ed. New York: Routledge.
This book provides an overview of the theory and principles central to Rash analysis, including information on model extensions (Rating Scales, the Partial Credit Model, Many-facet models). While less time is spent covering application of the Rasch model, the book includes a Rasch Software (Winsteps) CD. Applying the Rasch Model
Andrich D (1998). Rasch models for measurement. Series: quantitative applications in the social sciences. London: Sage Publications.
This short book reviews the general principles underlying the Rasch Model and focuses on the simple logistic model for dichotomous data. Concepts are solidified through use of one example throughout the text. Rasch models for measurement
Rasch, G. (1980). Probabilistic models for some intelligence and attainment tests (Expanded ed.). Chicago: University of Chicago Press.
This book provides the foundation for the Rasch family of IRT models. It provides a review of the theory and mathematical basis of the model with a focus on the application of the approach to the field of education.
Wright, BD. & Stone MH. (1979). Best test design. Chicago: MESA Press.
This book provides an overview of Rasch analysis for dichotomous data. Wright 1982 and Linacre 1989 provide overviews of extensions to the dichotomous model.
Methodological Articles
Wright B. (1997) A history of Social Science Measurement. Available here
Belvedere SL, de Morton NA. 2010. Application of Rasch analysis in health care is increasing and is applied for variable reasons in mobility instruments. Journal of Clinical Epidemiology. 62:1287-1297.
Sica da Rocha N, Chachamovisch E, de Almeida Fleck MP, Tennant A. 2013. An introduction to Rasch analysis for psychiatric practice and research. Journal of Psychiatric Research. 47: 141-148.
Tennant A. Conaghan PG. 2007. The Rasch measurement model in rheumatology: what is it and why use it? When should it be applied, and what should one look for in a Rasch paper? Arthritis & Rheumatism. 57:8; 1358-1362.
Tesio L. Simone A. Bernardinello M. 2007. Rehabilitation and outcome measurement: where is Rasch analysis-going? Eura Mediocphys. 43: 417-26.
Application Articles
Suglia SF, Ryan L, Wright R. 2008. Creation of a Community Violence Exposure Scale: Accounting for What, Who, Where, and How Often. J Trauma Stress. 2008 Oct; 21(5)479-486.
This papers provides an example of application of the Rasch Model within the field of Public Health research. The authors used the continuation ratio model (an extension of the original Rasch model) to create a scale for measuring exposure to community violence (ETV) among women living in an urban area. The paper presents the study population, background on items, methodological approach, results, and a discussion of findings and comparison of the Rasch ETV model to prior variations.
Franchignoni F, Giordano A, Gianpaolo R, Rabini A, Ferriero G. 2014. Rasch validation of the activities-specific balance confidence scale and its short versions in patients with Parkinson’s disease. J Rehabil Med. 46: 00-00 (ahead of print).
This recent paper demonstrates application of the Rasch model to a clinical population. The authors use the Rasch model to assess whether a long-version of an assessment used to measure the psychological aspects of balance (i.e. fear of falling) in a Parkinson’s population can be reduced to a shorter version that will take less time to complete. The authors conduct the analysis using WINSTEPS and provide a review of classical vs modern test theory.
Mair, P., and Hatzinger, R. (2007). Extended Rasch modeling: The eRm package for the application of IRT models in R. Journal of Statistical Software, 20(9), 1-20.
This article provides an overview of Rasch modeling using the eRm package in R, including example applications for the original (dichotomous) model and the following extensions: linear logistic test models, rating scale models, linear rating scale models, partial credit models and linear partial credit models. The package allows the user to conduct: person and item estimates, Likelihood ratio tests for model fit, Wald tests for item-specific fit, residual item and person fit statistics, and various plots for visualization of fit.
Software
|
Software |
Platform |
Estimation Method |
Cost |
|
PC only |
CMLE |
Paid |
|
|
PC & Mac |
CMLE |
Free |
|
|
PC & Mac |
CMLE |
Paid |
|
|
Quest |
PC & Mac |
JMLE |
Paid |
|
PC only |
JMLE |
Paid |
|
|
PC only |
Pairwise CMLE |
Paid |
*CMLE: Conditional Maximum Likelihood Estimation, JMLE: Joint Maximum Likelihood Estimation
Websites
Wikipedia The wikipedia page on Rasch modeling provides an easy-to-read history of the Rasch model, its features, and applications of it to dichotomous data and extensions.
Rasch model SIG This website provides links to diverse articles on Rasch Modeling compiled by the Rasch Model Special Interest Group.
Courses
Rasch Measurement Special Interest Group (SIG): https://www.rasch.org/rmt/rmtsub.htm#:~:text=Our%20Special%20Interest%20Group%20is,Measurement%20Seminars%20held%20in%20Chicago
This Special Interest group is part of the American Educational Research Association. The group is focused on development of empirically testable instruments with linear measures for use in the social sciences. The annual membership fee is $10 and the application can be completed online!
Rasch Applications: http://www.statistics.com/rasch-applications-1/
The aim of this intermediate-level online workshop is to teach social scientists about the practical aspects of Rasch analysis (data import, analysis, fit, interpretation) and the underlying theory that supports its application. The course is four-weeks long and uses Winsteps software. Tasks include concept tests, a modeling project and readings. Tuition is $629.00 and dates can be found at the website above.